Combined Environmental Reliability Testing for EV Busbars: Temperature, Humidity, and 3-Axis Random Vibration
Oct 17, 2026
EV battery-pack busbars cannot be qualified reliably through temperature, humidity, or vibration tests performed in isolation. A combined environmental profile exposes the actual interaction between thermal expansion, moisture, mechanical preload loss, fretting at bolted interfaces, and insulation stress, allowing failure mechanisms to be identified before vehicle-level durability testing.
For high-voltage battery applications, Apollo evaluates busbar assemblies under customer-defined combined profiles that can include -40°C to 125°C temperature cycling, up to 95% RH, and 3-axis random vibration, with vibration methodology referenced to ISO 16750-3 where applicable. Electrical resistance, fastening integrity, insulation condition, and post-test dimensional characteristics are correlated with the environmental load history.

-40°C to 125°C Thermal Cycling and 95% RH: Why Single-Factor Testing Misses Busbar Failures
Thermal Expansion at ΔT = 165°C: Copper, Aluminum, Insulation, and Fasteners
A busbar assembly contains materials with different coefficients of thermal expansion (CTE).
A temperature range from -40°C to 125°C produces a thermal span of 165°C. Copper, aluminum, polymer insulation, stainless-steel fasteners, and plated interfaces respond differently to this temperature change.
This differential expansion can generate:
Bolt preload variation
Contact-interface shear
Localized bending stress
Insulation movement
Cracking around formed sections
Fretting at bolted joints
A busbar that passes a static resistance test at 23°C may therefore show a different resistance profile after repeated thermal cycling.
95% RH and Condensation: Corrosion and Interface Degradation
High relative humidity creates an additional mechanism at exposed interfaces.
Potential failure locations include:
Plated copper terminals
Bolt and washer interfaces
Exposed conductor edges
Insulation defects
Crimped or welded transition areas
Moisture combined with temperature variation can accelerate surface oxidation and corrosion products. At a bolted electrical interface, even a small increase in contact resistance becomes significant at hundreds of amperes because
That 16 W is generated locally at the connection rather than distributed along the entire busbar.
ISO 16750-3 Vibration and Environmental Interaction: Mechanical Loading
ISO 16750-3 addresses mechanical loads for road vehicles and provides vibration-test approaches according to component location and vehicle application.
For an EV battery-pack busbar, the relevant mechanical environment may contain:
Broadband random vibration
Multiple vibration axes
Road-induced shocks
Resonance amplification
Fastener excitation
Local bending of flexible sections
The test profile must be established from the vehicle location, mounting structure, mass, and customer durability specification rather than assigning one universal vibration spectrum to every battery busbar.
3-Axis Random Vibration and 165°C Thermal Span: Combined Test Architecture
Three-Axis Excitation at X/Y/Z: Replicating Battery-Pack Mechanical Loads
A production busbar assembly should be mounted using the same:
Fasteners
Torque specification
Insulation components
Support brackets
Connector interfaces
Mounting points
used in the vehicle or battery-pack configuration.
The three principal directions are normally evaluated as:
| Axis | Typical Mechanical Concern | Busbar Failure Mechanism |
| X-axis | Longitudinal excitation | Terminal/interface shear |
| Y-axis | Lateral excitation | Fastener loosening and bending |
| Z-axis | Vertical excitation | Support fatigue and resonance |
| Combined sequence | Multi-directional loading | Interaction of thermal and mechanical stresses |
The objective is not simply to demonstrate that the copper conductor survives vibration. The complete assembly must maintain electrical and mechanical functionality.
Random Vibration PSD at Vehicle-Specific Frequencies: Resonance Control
Random vibration is normally defined using a power spectral density (PSD) profile in:
The highest mechanical stress may occur near a natural frequency rather than at the highest nominal acceleration.
For this reason, engineering validation should identify:
Natural frequency
Resonance frequency
Damping ratio
Mode shape
Acceleration response
Relative displacement between mounting points
A busbar with a long unsupported copper span can exhibit significantly higher dynamic displacement than a short rigid conductor.
Thermal-Vibration Interaction at -40°C and 125°C: Structural Resonance Shift
Temperature changes can alter polymer modulus, copper stress state, insulation flexibility, and joint stiffness.
At low temperature:
Polymer insulation may become less compliant
Flexible support elements can stiffen
Thermal contraction increases interface displacement
At high temperature:
Polymer modulus can decrease
Insulation may soften
Fastener preload can change
Differential thermal expansion increases
The vibration test should therefore include temperature states representative of the intended vehicle environment rather than relying exclusively on room-temperature vibration.
Request Free Reliability Engineering Evaluation
Fastener Preload at 400–800V and mΩ Resistance: Monitoring Bolted Busbar Interfaces
Belleville Washer Preload at High Vibration: Preventing Joint Loosening
Bolted busbar connections depend on stable clamping force.
A typical joint consists of:
Bolt → Belleville washer → terminal → busbar → mating terminal → nut
The preload creates the normal force required to maintain a low-resistance electrical interface.
A Belleville washer can provide controlled elastic displacement as the joint stack-up changes through thermal expansion and vibration.
Compared with a rigid flat washer, the spring characteristic of a Belleville washer can provide greater compensation for small changes in joint compression.
Preload Loss After 3-Axis Vibration: Torque Is Not Enough
Initial bolt torque does not prove long-term joint integrity.
Torque is an indirect indicator of preload because friction at the thread and bearing surface consumes a large portion of applied torque.
For reliability validation, Apollo can correlate:
Initial tightening torque
Initial bolt preload
Thermal cycling
Vibration exposure
Final preload
Contact resistance
Interface wear
A useful engineering acceptance criterion is therefore based on measured preload retention and electrical resistance, not torque alone.
Fretting Wear at <1 mΩ Interfaces: Resistance Growth Detection
Microscopic relative movement between two contacting surfaces can cause fretting.
The process may generate:
Removal of plating
Oxide formation
Metallic debris
Reduced real contact area
Increased contact resistance
Localized Joule heating
The failure can develop gradually, making continuous or periodic four-wire resistance measurement more informative than visual inspection alone.
For high-current EV busbars, resistance changes should be tracked against:
Cycle count
Temperature
Vibration axis
RMS acceleration
Joint preload
Interface condition
Flexible Copper Foil and Braided Transition Sections: Reducing Resonance-Induced Shear Stress
Multi-Layer Copper Foil at High Flexibility: Strain Distribution
Rigid copper busbars are efficient for short, fixed-distance connections but can transmit mechanical displacement directly between mounting points.
A flexible transition section changes the mechanical load path.
Common structures include:
Multi-layer copper foil
Laminated copper foil
Copper braided conductor
Stamped flexible links
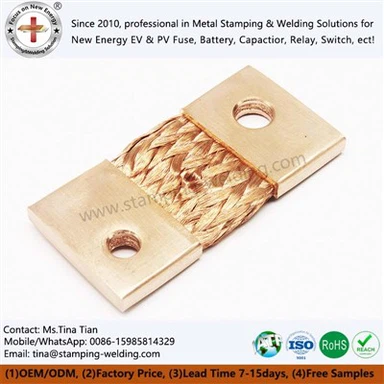
Braided copper expansion connectors
The flexible section absorbs relative displacement between battery modules, busbar terminals, and structural supports.
Flexible Braided Copper at 100% IACS-Class Conductivity: Electrical and Mechanical Trade-Off
Electrical conductivity and mechanical flexibility must be evaluated together.
| Structure | Electrical Path | Flexibility | Vibration Accommodation | Typical Use |
| Rigid C1100 copper bar | Low resistance | Low | Low | Fixed connection |
| Multi-layer copper foil | Low resistance | High | High | Battery interconnect |
| Braided copper conductor | Low resistance | Very high | Very high | Expansion/vibration transition |
| Laminated busbar | Low inductance potential | Medium | Medium | Power electronics |
| Flexible stamped copper link | Low resistance | Medium–High | High | Compact battery modules |
High-purity copper such as C1100 can provide conductivity approaching 100% IACS, depending on material condition and specification.
Stray Inductance <10nH: Flexible Geometry in High-Speed Power Switching
For high-current switching systems, mechanical flexibility does not remove electrical design requirements.
A laminated or closely coupled conductor geometry can reduce loop area and associated parasitic inductance.
Even a small inductance becomes relevant when (di/dt) is high.
Therefore, flexible sections used around inverter or battery switching structures should be evaluated for both:
Mechanical strain relief
Electrical loop geometry
The final geometry depends on current rating, switching frequency, insulation system, mounting envelope, and customer electromagnetic compatibility requirements.

Insulation Sleeve at 125°C and Dielectric Strength >15kV/mm: Detecting Environmental Cracking
Thermal Stress at -40°C to 125°C: Polymer Insulation Failure Points
Busbar insulation can fail even when the copper conductor remains electrically functional.
High-risk locations include:
Sharp stamped edges
Formed corners
Bolt holes
Terminal transitions
Molded supports
Areas under mechanical compression
Repeated thermal expansion and contraction can produce tensile strain in the polymer.
At the same time, random vibration can create cyclic bending around the same location.
The combined mechanism is more severe than either load alone.
UL 94 V-0 Insulation and High-Voltage Dielectric Testing
For EV battery applications, insulation material selection may involve:
Operating temperature rating
Dielectric strength
Flame resistance
Chemical resistance
Tracking resistance
Environmental aging
Where specified by the material system, UL 94 V-0 can be used as a flammability classification.
A dielectric strength specification such as >15 kV/mm must be treated as a material or system-specific requirement and verified under the applicable test method.
The test program should also examine insulation after environmental exposure for:
Cracks
Pinholes
Delamination
Edge lifting
Abrasion
Carbonized areas
Post-Test Insulation Resistance at 400–800V: Electrical Safety Verification
Environmental testing should be followed by electrical inspection.
Depending on the customer's validation specification, measurements can include:
Insulation resistance
Dielectric withstand
Leakage current
Hi-pot test
Visual insulation inspection
Continuity testing
The electrical acceptance limits should be established from the vehicle architecture and applicable safety standard.
CMM Inspection at ±0.01mm and Resistance Mapping: Pre-Test and Post-Test Correlation
CMM Measurement at ±0.01mm: Detecting Permanent Deformation
Environmental testing should not end with a pass/fail electrical result.
A busbar may retain electrical continuity while experiencing permanent mechanical deformation.
CMM inspection can measure:
Terminal position
Hole-to-hole distance
Flatness
Bend angle
Mounting height
Flexible-section geometry
Connector alignment
Pre-test and post-test measurements are compared to identify permanent dimensional drift.
Four-Wire Resistance at mΩ Resolution: Mapping Joint Degradation
A four-wire Kelvin measurement separates voltage-sensing leads from current-carrying leads, reducing measurement error caused by lead resistance.
For busbar qualification, resistance should be recorded:
Before test → during defined intervals → after test
This creates a resistance-versus-cycle profile.
A resistance increase should then be correlated with:
Fastener preload loss
Fretting marks
Oxidation
Plating wear
Copper deformation
Thermal exposure
Cross-Section Analysis and Microscopy: Identifying Fretting and Fatigue
When resistance increases after vibration, destructive analysis can locate the failure mechanism.
Typical analysis includes:
Optical microscopy
Metallographic cross-section
SEM where required
Plating thickness measurement
Surface morphology analysis
Joint fracture analysis
The objective is to distinguish between electrical interface degradation and bulk conductor fatigue.
Request Busbar Reliability Test Review

ISO 16750-3 Vibration and EV Battery Validation: From Component Test to Vehicle Durability
Battery-Pack Mounting at -40°C to 125°C: Test Fixture Fidelity
A test fixture must reproduce the mechanical boundary conditions of the production installation.
Fixture design should account for:
Mounting-point stiffness
Fastener type
Torque
Support spacing
Cable routing
Busbar mass
Connector constraints
An overly rigid fixture can suppress real vibration modes. An overly flexible fixture can introduce artificial resonance.
Therefore, fixture modal behavior should be checked before interpreting component test data.
Combined Environmental Test Matrix: Temperature × Humidity × Vibration
A structured validation matrix may be organized as follows:
| Test Stage | Temperature | Humidity | Vibration | Primary Measurement |
| Baseline | 23°C | Ambient | None | Resistance + dimensions |
| Low-temperature exposure | -40°C | Defined by profile | Defined PSD | Resistance + function |
| High-temperature exposure | 125°C | Defined by profile | Defined PSD | Resistance + insulation |
| High-RH exposure | Defined by profile | Up to 95% RH | Defined PSD | Corrosion + insulation |
| Combined profile | -40°C to 125°C | Up to 95% RH | X/Y/Z random | Full electrical/mechanical data |
| Post-test | 23°C | Ambient | None | CMM + resistance + visual |
Not every program requires simultaneous maximum temperature, maximum humidity, and maximum vibration. The test matrix should reflect the vehicle duty cycle and customer specification.
Failure Mode Analysis at IATF 16949: PFMEA-Driven Reliability Testing
Environmental reliability testing becomes more useful when each test condition is linked to a predefined failure mode.
For an automotive busbar program, PFMEA can identify:
Joint loosening
Fretting corrosion
Conductor fatigue
Insulation cracking
Plating degradation
Terminal deformation
Resistance increase
Dielectric failure
The Control Plan can then define the corresponding production controls and inspection frequencies.
This creates a closed engineering loop:
Design → FEA → Prototype → Environmental Test → Failure Analysis → DFM → Tooling → SPC → PPAP Level 3 → Mass Production
Apollo EV Busbar Reliability Engineering: C1100 Copper, Flexible Links, and PPAP Level 3
C1100 Copper at High Conductivity: Material and Forming Control
Apollo's EV busbar manufacturing process can incorporate precision copper stamping, bending, forming, surface treatment, insulation, and flexible transition structures according to the customer's drawing and electrical specification.
Typical engineering inputs include:
C1100/C10200 copper grades
Copper thickness
Plating specification
Bend radius
Hole diameter
Mounting pitch
Insulation requirement
Current rating
Temperature rise limit
Precision Stamping at ±0.01mm: Geometry and Assembly Fit
Critical busbar dimensions can be monitored using:
CMM inspection
Optical measurement
Go/no-go gauges
Flatness measurement
Burr inspection
SPC
Dimensional tolerances should be assigned according to functional requirements rather than applying ±0.01mm indiscriminately to every feature.
PPAP Level 3 and IATF 16949: Production Validation Documentation
For automotive programs, Apollo can structure project quality documentation around customer PPAP requirements, including:
Process Flow Diagram
PFMEA
Control Plan
Dimensional Inspection Report
Material Certification
MSA documentation
SPC data
Capability studies
Functional test results
Sample submission records
The final submission level and specific documents remain subject to the customer's purchasing and quality requirements.
FAQ
What temperature range should an EV busbar environmental reliability test use?
A customer-defined profile may include -40°C to 125°C for EV battery applications. The actual temperature limits, dwell time, transition rate, and number of cycles should be based on the battery-pack location and vehicle validation specification.
How is EV busbar random vibration testing performed?
The busbar assembly is mounted in its production configuration and exposed to vehicle-specific vibration profiles, commonly including X/Y/Z excitation. ISO 16750-3 can provide the mechanical test framework, while the customer defines the applicable PSD and duration.
How can Apollo detect busbar failure after combined thermal and vibration testing?
Apollo can compare pre- and post-test CMM dimensions, four-wire resistance, fastener preload, insulation condition, and interface wear. Metallographic analysis can then identify fretting, fatigue, corrosion, or joint degradation.
contact us